EECS 556 Computer Assignment #1
Jim Huth & Joe Mancuso
Emad Ebbini, Instructor
Introduction
We thought the web was a perfect medium for displaying the images, m-files and comments
resulting from our work, so we set up this page for our first computer assignment.
The answers to the parts a through i follow below, but you can also skip to the gallery of
images or listing of mfiles resulting from our work.
And our answers are...
Part a
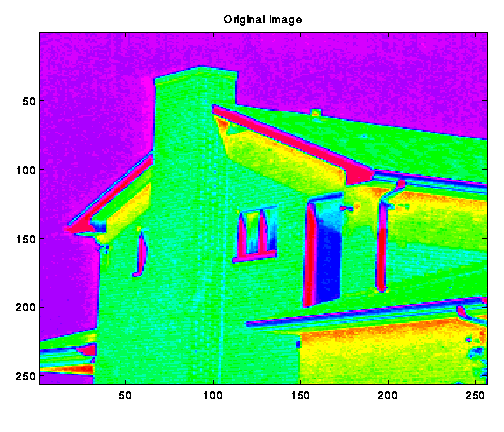
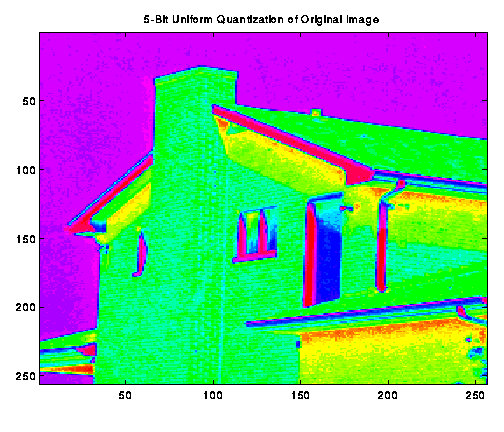
First, we applied a 5-bit uniform quantizer to the original image.
The result is shown in Image a-2. The uniform quantizer had the obvious
effect of reducing the number of levels of pixel intensity in the image
from the original (8-bit) 256 levels to the quantized (5-bit) 32 levels.
The histogram of the original image showed that there were two primary
concentrations of pixels intensity levels at the levels of ~110(42% of max
intensity) and at ~190(74% of max intensity). The colors shown in the
image that correspond to these intensity levels are "yellow/green" and
"lt-blue/purple", respectively. The width of the peak at 74%MAX intensity
was considerably narrower than the 42%MAX peak. The uniform quantization
reduced the number of intensity levels representing this peak from
approximately 16 in the original image to 2 in the quantized image. This
is observed as a loss of pixel intensity variety in the sky. The change to
the 42%MAX levels can be observed as a blending of the green regions on
the chimney into a more continuous color, also loss of intensity
resolution.
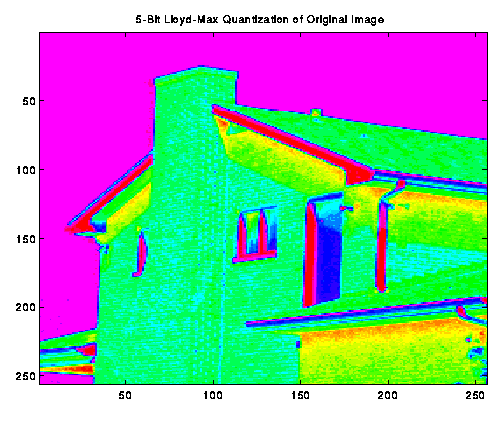
The Lloyd-Max quantization, however, provides an increased amount of
intensity resolution (more finely spaced intensity levels) at the
intensity levels with a greater representation in the image. Conversely,
contiguous levels that have a low population in the image will tend to be
lumped into fewer intensity levels resulting in a coarser intensity
resolution for these levels. These effects can be seen in Image a-3:
the sky with intensity values of >80%MAX (pink/purple in the original
image) can be seen in the histogram to have a relatively low occurence
rate in the image. Their intensity level then will be lumped towards the
pink (representing the maximum intensity possible). The blue/purple
regions with a higher representaion in the image, will be more finely
resolved than in the uniform quantized case. Also, the green areas of the
original image will not suffer from the intensity blending effects as
much as the same areas had under the uniform quantizer. For
example, we can see finer structure in the chimney of the Lloyd-Max
quantized image than in the uniform quantized image.
Part b
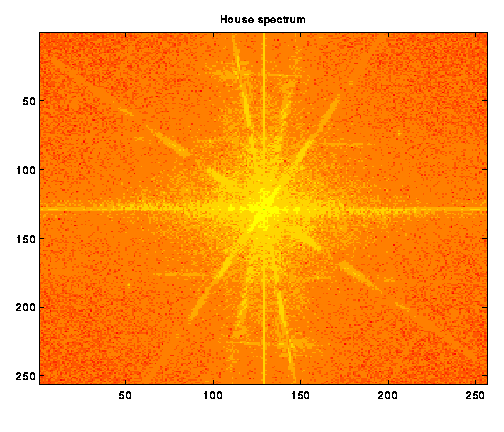
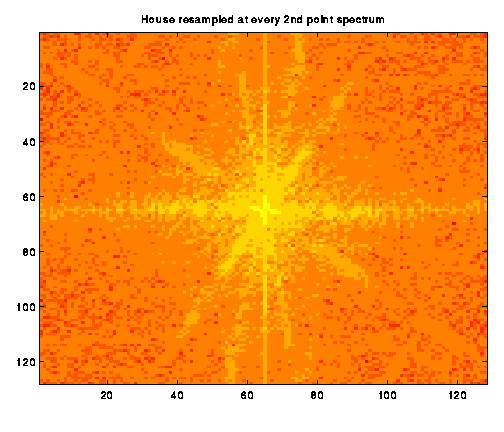
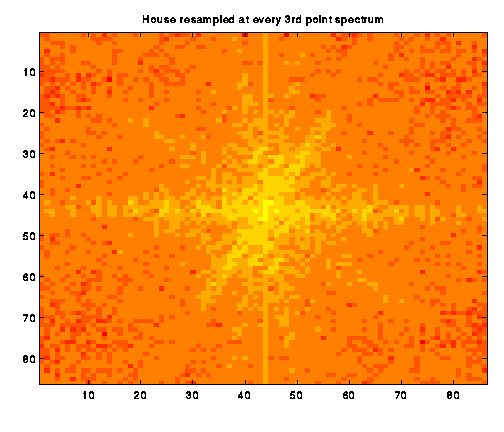
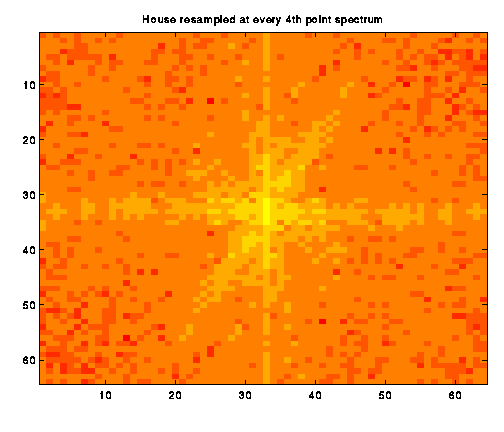
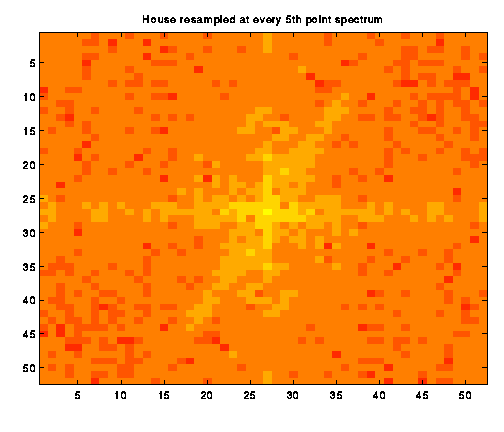
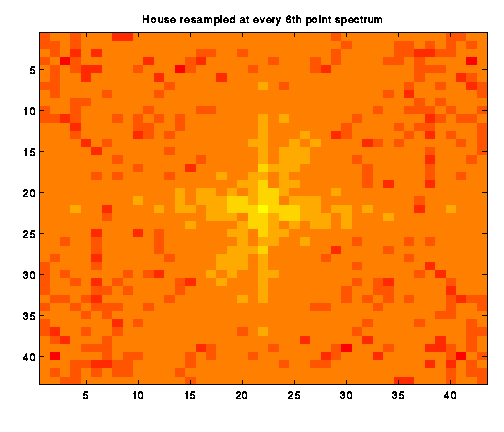
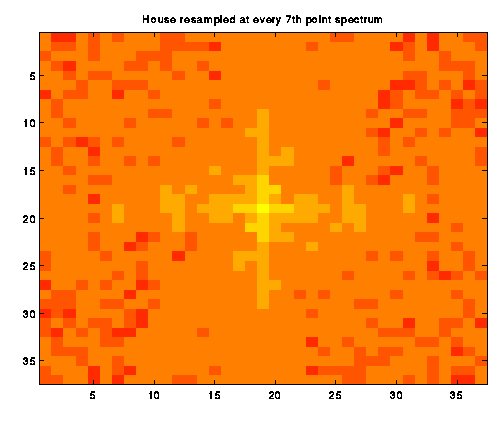
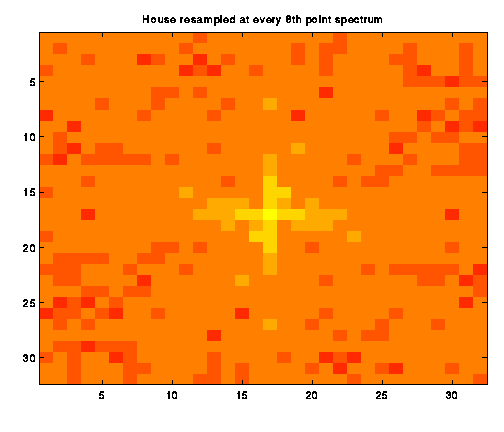
We next began sampling the images at reduced rates, computing and
observing the resulting spectrum. The images are included below. We
would have expected to see copies of the unsampled image to begin to
overlay each other as the sampling rate fell below the Nyquist Criteria
Rate. However, the coarseness of the resulting images makes it difficult
to see when aliasing is beginning to occur.
The original spectrum shows a very nice starlike
pattern of low-frequency information. As Image b_2
shows, the pattern becomes courser as pixels are skipped. We continued
downsampling, taking the spectrum of images where every 3rd,
4th, 5th, 6th,
7th, and 8th pixel was skipped
in both dimentions.
Aliasing, in general, causes high frequency information to appear in the lower
frequency regions of the spectrum. The Part c
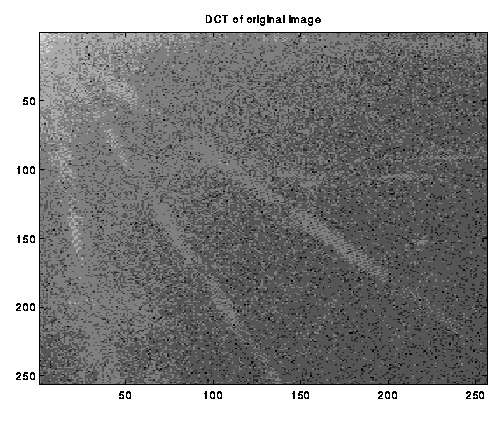
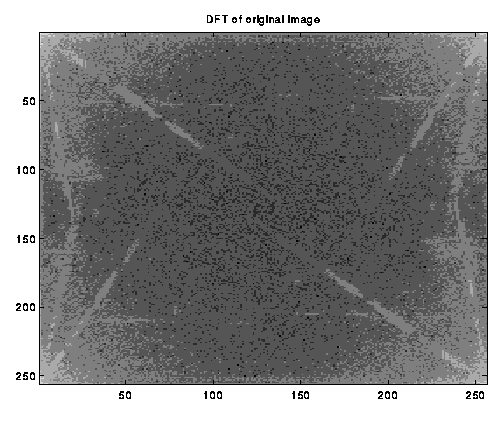
We used MATLAB's FFT2 and DCT2 to create the DFT and DCT
greyscale images we have. Comments are in Part e below.
Part d
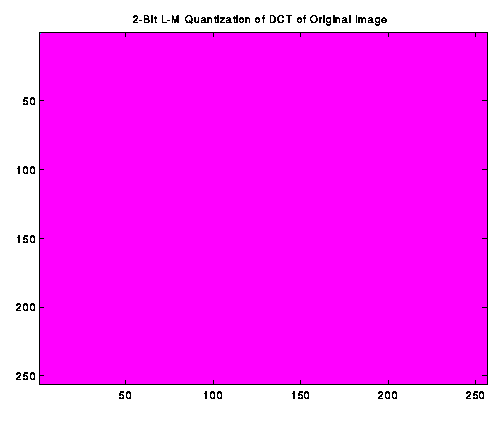
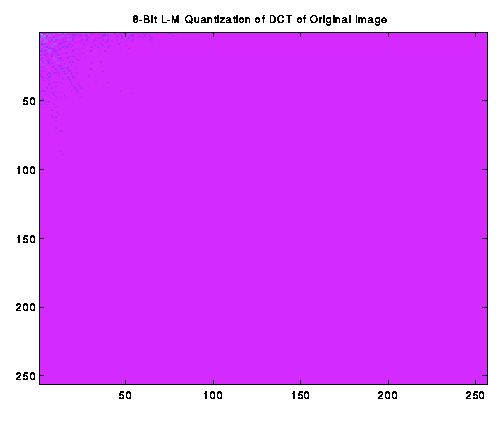
We quantized the DCT and DFT images using both the 2-bit and 8-bit Lloyd-Max algorithms.
The 2-bit DCT, 8-bit DCT, 2-bit DFT
and 8-bit DFT are shown below. Our comments are in Part e below.
Part e
The DCT and DFT in part 'c' yielded acceptable results. In the DFT
image, we can observe features corresponding to the dominant lines of the
original image. Quantizing the DFT transformed images using the 2-bit and
8-bit Lloyd-Max resulted in pushing almost all of the intensity
resolution towards the DC term. As a result, in the 2-bit DCT case, there
remains a single pixel in the upper left-hand corner of the image. In
the 8-bit DCT case, there is a little more pixel variety around the DC
term, but all higher frequencies are represented by a single intensity level.
In the DFT case, we have nearly the same result.
Part f
We calculated the following SNR values for our quantized-transform reconstructions:
- 2-bit DCT SNR: 5.9112e-07
- 2-bit DFT SNR: -0.0127
- 8-bit DCT SNR: 1.3881e-04
- 8-bit DFT SNR: -0.0117
Part g
The images resulting from this section were suprising and unexpected.
However, we are sure that we are correct! We triple-checked our
procedure only to yield similarly boring results.
The images reconstructed from the 2-bit DCT,
8-bit DCT, 2-bit DFT
and 8-bit DFT are shown below.
Our comments (however brief) are in Part h below.
Part h
According to our calculations, the energy in the various cases was more a
function of the transform used than of the bit quantization used. It seems
that image construction on this level is not viable. Other algorithms must
be employed (based on what we've seen) to successfully perform data compression.
Part i
We calculated the following Eb values for our quantized-transforms:
- 2-bit DCT: 3.5264e+03
- 8-bit DCT: 3.5296e+03
- 2-bit DFT: 4.2457e+06
- 8-bit DFT: 4.2460e+06
The Image Gallery
Here we present the images we created in MATLAB for this assignment. They are further explained in the problem
answers above. Your browser can likely snag it for full size viewing if you wish.
Part a
Part b
Part c
Part d
Part g
The M-files Listing
Here are the descriptions of the critical m-files that generate our results.
- uniform.m
- This is the function we defined to uniformly requantize a matrix's entries to the set of
integers from 0 to 2^b - 1, where b is the number of bits requested.
- lloyd_max.m
- This function returns a matrix that is requantized over its original range, but with the
quantization levels and step sizes determined by the Lloyd-Max algorithm.
- parta.m
- This m-file loads and generates the original image and requantized images requested in
part a.
- partb.m
- This m-file generates the various frequency-domain images for part b, based on increasingly
smaller sampling frequencies applied to the original image.
- partc_dct.m
- This file generates the greyscale DCT of the original image.
- partc_dft.m
- This file generates the greyscale DFT of the original image.
- partd.m
- This file creates the multitudenous transforms requantized to 8, 6, 4 and 2 bits using both
the uniform and Lloyd-Max quantizers.
- partf.m
- This file reports the SNRs for part f, gives the Eb values for part i, and generates the images
for party g. It's handy. The diary of this m-file's output is
available for perusal.
mancuso@umich.edu
![[Earthshine on crescent moon]](../images/earthshine.gif)


